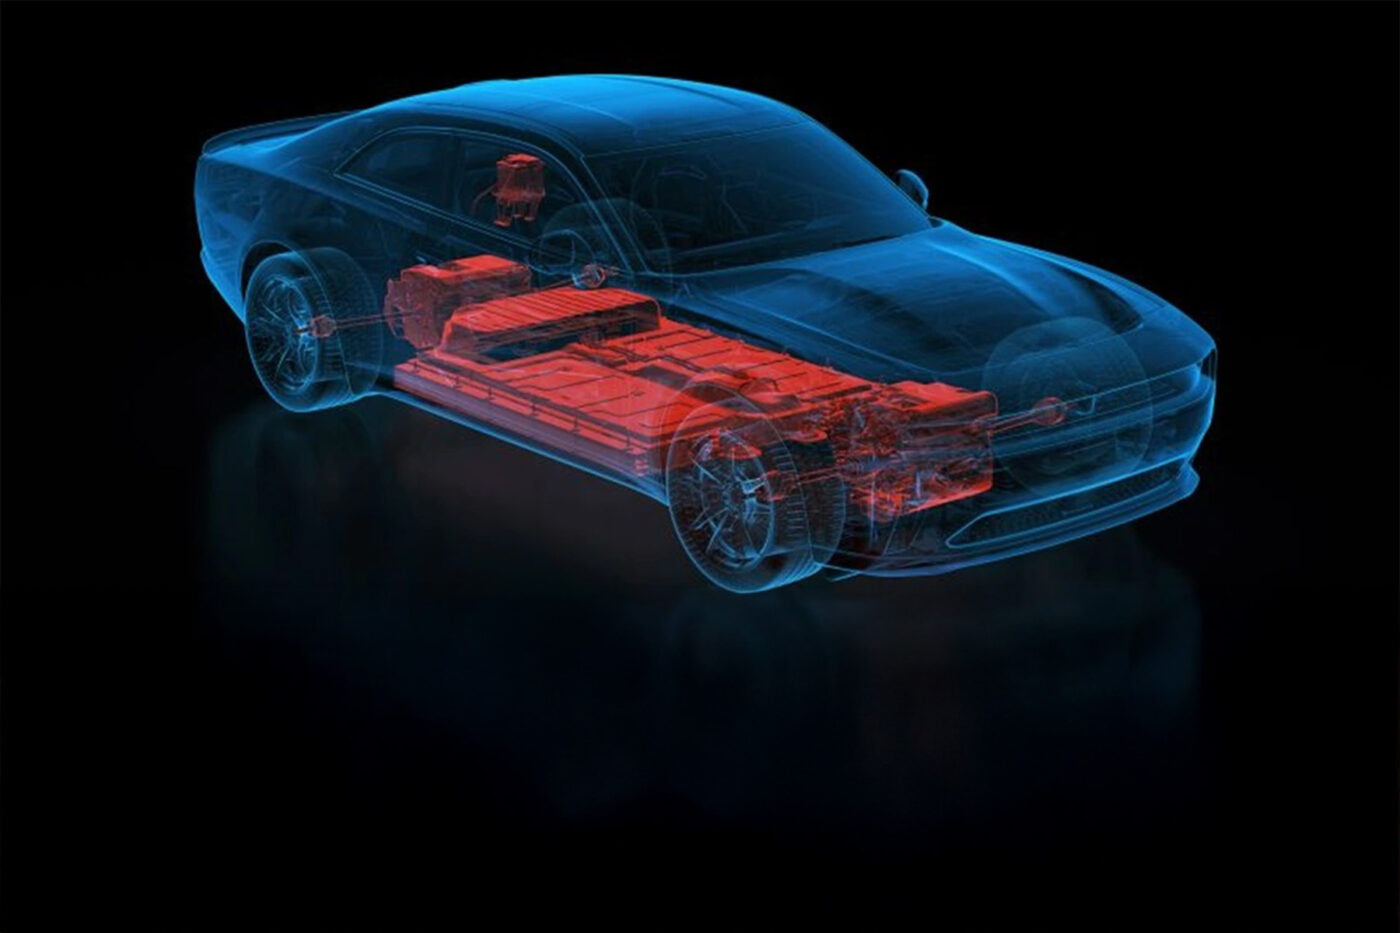
Un nuevo estudio lo demuestra: Las baterías de los VE duran mucho más de lo esperado
A veces se trata del trabajo infantil en la minería del cobalto, otras de la ansiedad por la autonomía o del colapso de la red eléctrica si todos los coches eléctricos se cargan al mismo tiempo... Internet está lleno de afirmaciones falsas y medias verdades sobre los coches eléctricos y sus baterías. Tan pronto como un tema se refuta con hechos o queda obsoleto por las mayores autonomías y las mejores redes de recarga, se difunde el siguiente rumor. Uno de estos mitos es el envejecimiento de las baterías: los coches eléctricos usados serán casi imposibles de vender ya que la batería envejece rápidamente, pierde autonomía y, en el peor de los casos, hay que sustituirla... supuestamente.
Como tantos mitos, el del envejecimiento de las baterías tiene un núcleo de verdad: las baterías envejecen de dos maneras. Así que cualquiera que quiera saber más sobre los coches eléctricos se topará tarde o temprano con este tipo de historias. Una cosa está clara: la batería es el componente más caro de un coche eléctrico, por eso surge la pregunta legítima de cómo afecta esto al valor residual del coche o con qué frecuencia hay que sustituir realmente las baterías de los coches eléctricos y qué consecuencias financieras tiene esto.
La consultora de gestión P3, especializada en movilidad eléctrica, realizó un estudio para dar una respuesta basada en hechos y contrarrestar los mitos sobre las baterías. En un primer paso, P3 examinó 50 coches eléctricos de su propia flota y posteriormente analizó los datos de medición reales de 7.000 coches eléctricos. P3 quiere utilizar los resultados para ofrecer a los consumidores una información completa que elimine los malentendidos sobre la movilidad eléctrica y la duración de las baterías. "La desinformación puede tener un impacto negativo en la transición a la movilidad eléctrica al alimentar temores infundados y reducir así la aceptación social y la penetración en el mercado de los vehículos eléctricos. Por lo tanto, proporcionar datos fiables y transparentes es crucial para ofrecer una imagen realista de la duración real de las baterías y reforzar así la confianza en los vehículos eléctricos", afirma el libro blanco.
El estado de salud como principal indicador
Antes de pasar a los resultados, aclaremos brevemente algunos términos. El "estado de salud", o abreviado SoH, es fundamental para el envejecimiento de las pilas. No existe una definición estandarizada al respecto; en esta publicación, P3 se refiere exclusivamente a la capacidad de la batería. El SoH se define como la relación entre la capacidad actual medida y la capacidad en estado nuevo; en sentido estricto, la capacidad neta en cada caso, es decir, el contenido energético que el cliente puede utilizar. La capacidad bruta, es decir, el contenido energético instalado en el vehículo, es mayor pero irrelevante en este caso. Al final, sólo cuenta la energía disponible para el cliente en el coche eléctrico. En otras palabras, la capacidad neta cuando la batería es nueva corresponde a un SoH del 100%. Si la capacidad actual disminuye posteriormente, el SoH también cae por debajo del 100%. Las condiciones de garantía del fabricante suelen especificar un 70% u 80% tras un determinado kilometraje o periodo de uso.

Para completar, a menudo se habla de envejecimiento "calendario" y "cíclico". Durante el envejecimiento calendario de una batería, las estructuras químicas de las celdas de la batería cambian, incluso sin un uso activo. El envejecimiento cíclico provoca un estrés adicional debido a la carga y descarga de la batería. Ambos factores no pueden evitarse por completo (más sobre esto más adelante) y no pueden separarse claramente el uno del otro. Por esta razón, la definición de SoH no incluye valores como el historial de carga y descarga, sino sólo la capacidad, que es relevante para los coches eléctricos desde el punto de vista del cliente.
Analizados los datos de más de 7.000 vehículos
La novedad de este estudio es que se basa en datos reales de vehículos en circulación. En su modelo SoH, P3 realizaba anteriormente predicciones sobre la vida útil basadas en datos académicos y mediciones de laboratorio, normalmente a nivel de célula. Los datos de los coches eléctricos no sólo añaden factores externos como las influencias medioambientales y el comportamiento de conducción y carga, sino también la programación del sistema de gestión de la batería y las estrategias de envejecimiento aplicadas por los fabricantes de automóviles en cuanto a cómo estresan y/o protegen sus baterías.
P3 adoptó dos enfoques para obtener los importantísimos datos de los vehículos: En primer lugar, se midieron 50 vehículos de la propia flota de la empresa, se examinó el envejecimiento previo de la batería y se correlacionó el SoH con el uso y el comportamiento de carga. "Los vehículos se seleccionaron para obtener información sobre el mayor número posible de perfiles de conducción y carga diferentes y para identificar las diferencias entre los fabricantes", afirma P3.
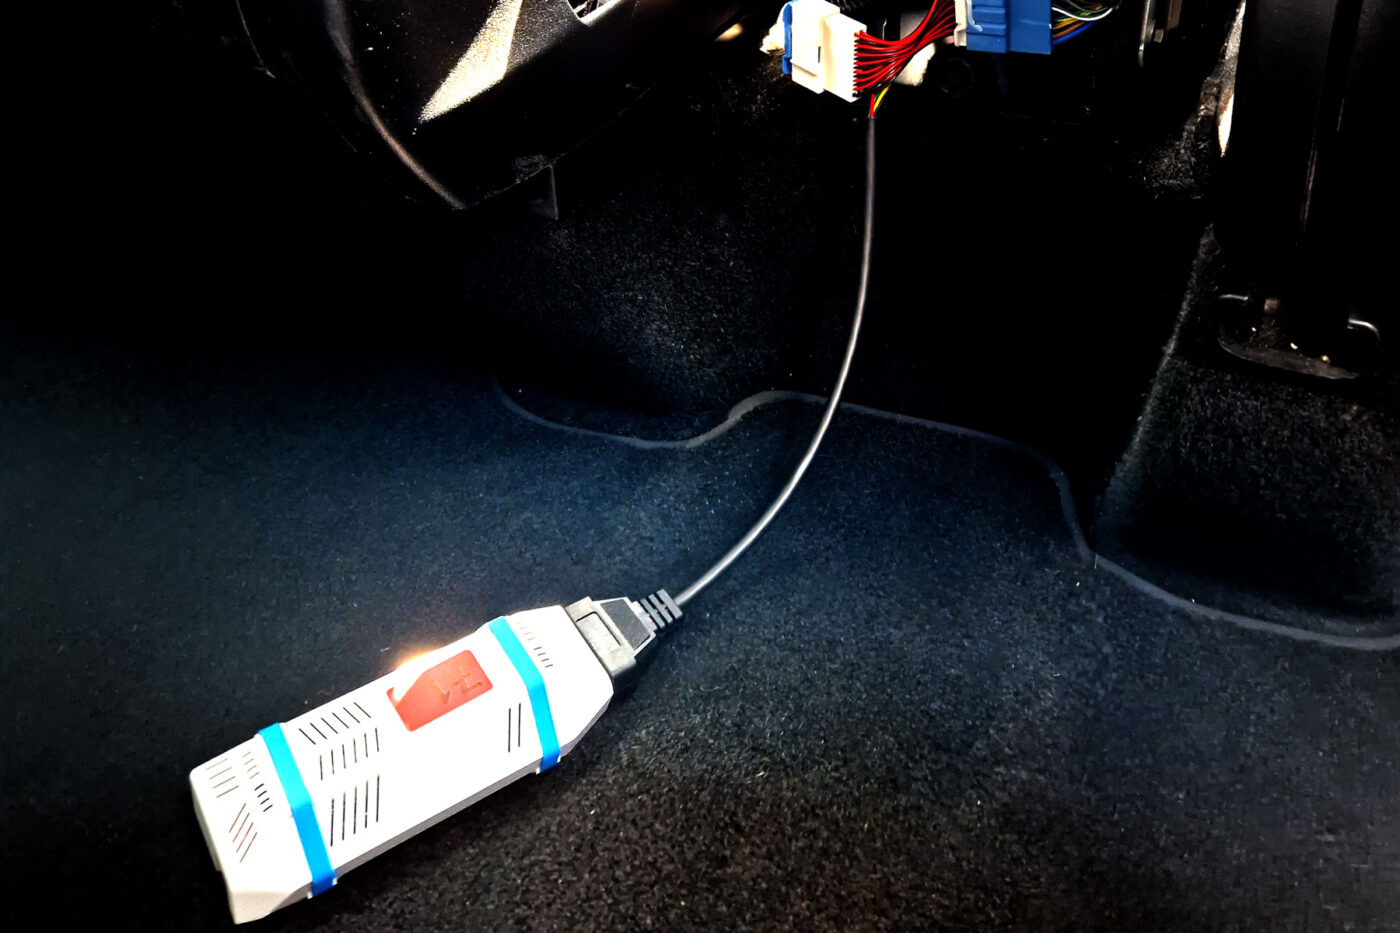
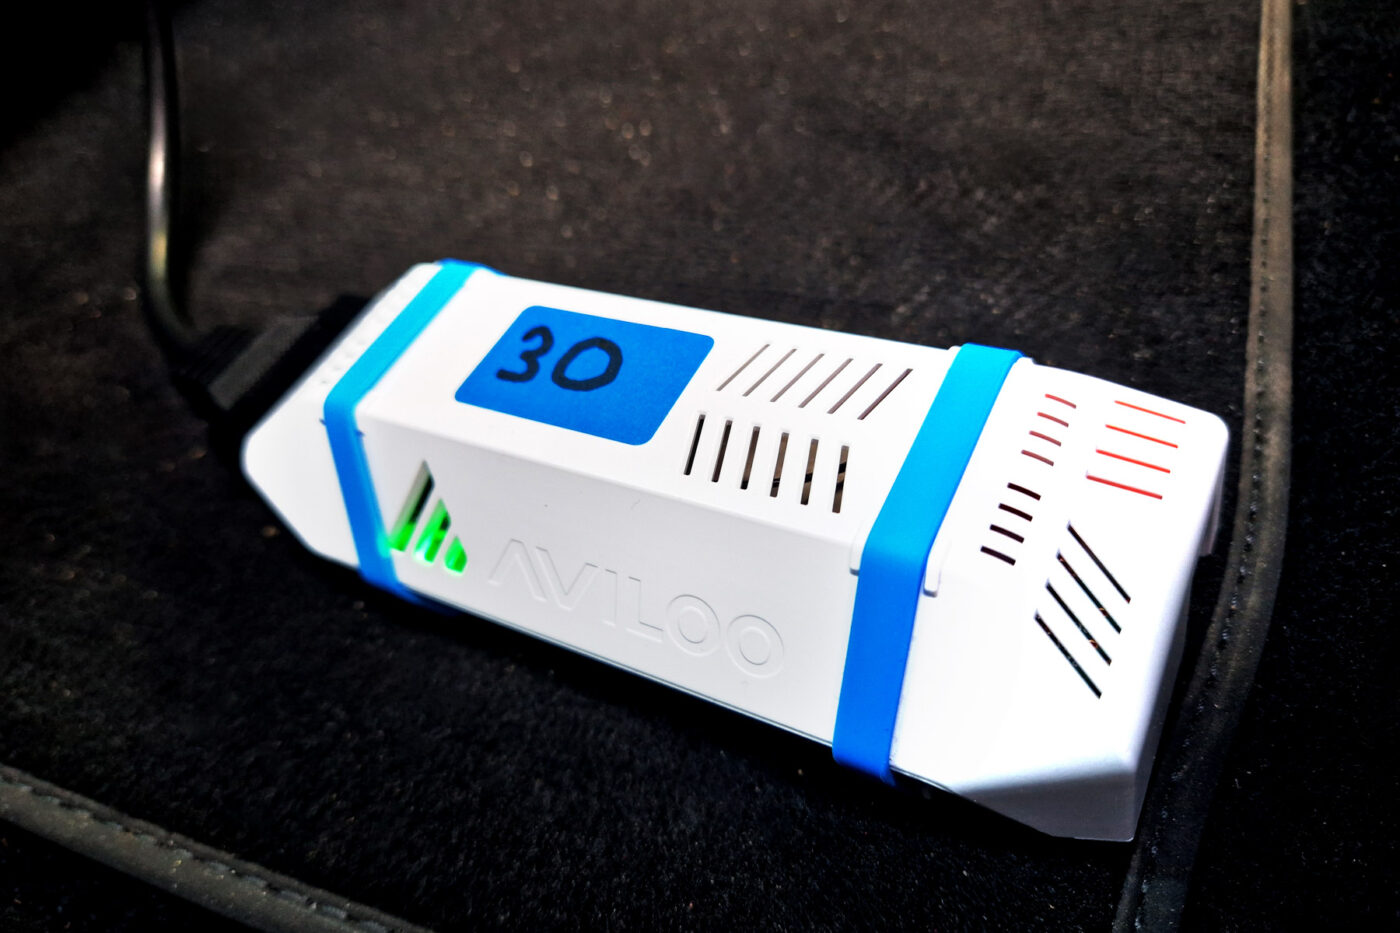
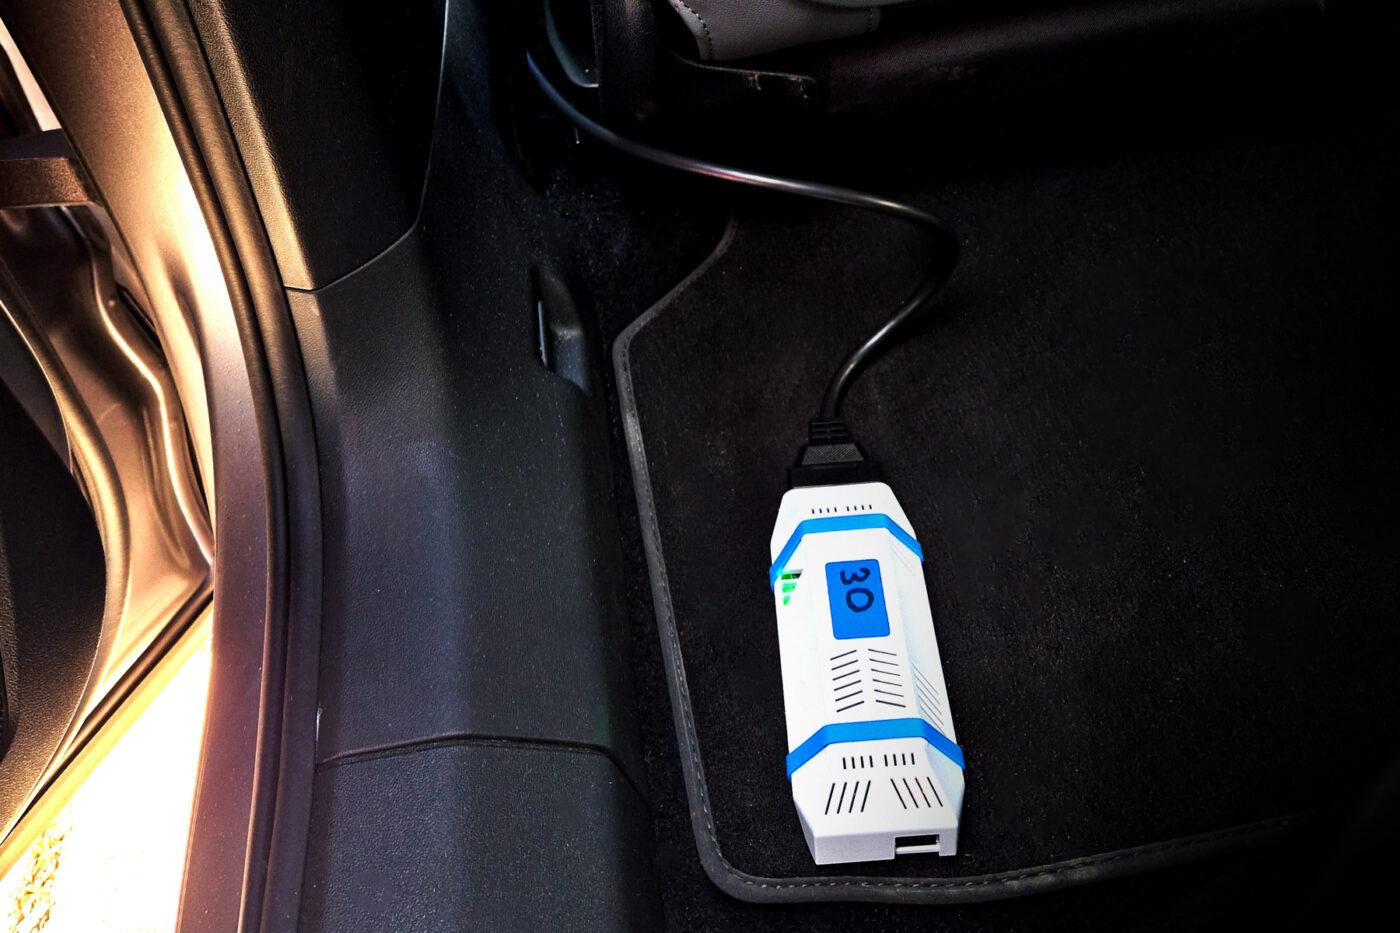
Para respaldar estos análisis individuales cualitativos con datos más cuantitativos, en el segundo paso participó la empresa austriaca de diagnóstico de baterías Aviloo. Según ésta, ya ha realizado más de 60.000 pruebas de capacidad. Una breve digresión: Aviloo ofrece dos análisis diferentes, el "Flash Test" y el "Premium Test". En ambos casos, el llamado Aviloo Box, un dongle DAB, se conecta al puerto DAB del vehículo. Para la 'Prueba Premium', la batería se carga al 100% y se reduce al 10% con el dongle conectado. De esta forma, se miden y analizan innumerables datos relevantes para la batería en los servidores de Aviloo. La 'Prueba Flash' sólo tiene lugar cuando el vehículo está parado, y analiza los valores medidos disponibles basándose en la base de datos que se configuró para el tipo de batería respectivo a través de la 'Prueba Premium'.
Para su análisis, P3 utilizó los registros de datos de más de 7.000 vehículos, todos ellos analizados mediante la "prueba Premium", un procedimiento más complejo pero también más preciso. Este conjunto de datos también incluía vehículos con un kilometraje superior a 300.000 kilómetros. "Esto permitió evaluar el envejecimiento de las baterías de forma más detallada y cuantitativa en relación con el kilometraje", afirma el libro blanco. "Esto complementa específicamente el análisis de la flota P3 y proporciona una base de datos más amplia para una evaluación bien fundamentada".
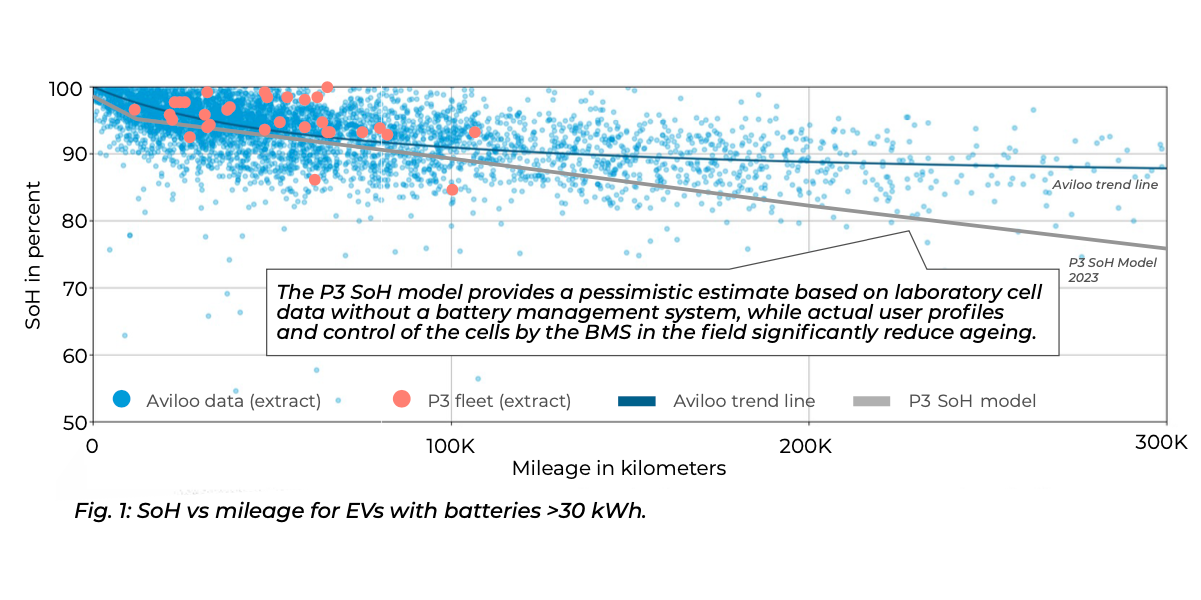
Y la evaluación tiene un resultado claro: en los primeros 30.000 kilómetros aproximadamente, la pérdida de capacidad se acelera, lo que significa que el estado de salud desciende con relativa rapidez del 100% a alrededor del 95%. La buena noticia es que la degradación real disminuye al aumentar el kilometraje. Los datos de Aviloo de los 7.000 vehículos muestran un SoH (medio) de alrededor del 90% a los 100.000 kilómetros. Y después de eso, la línea de tendencia es casi horizontal; entre los 200.000 y los 300.000 kilómetros, es casi estable - y está muy por encima del 70-80% de la garantía de la batería. De hecho, está más cerca del 87%.
Existe una explicación sencilla para la rápida pérdida de SoH en la fase inicial: en el ánodo (es decir, el terminal negativo) de la célula de la batería se forma la llamada capa SEI (interfase de electrolito sólido) durante los primeros ciclos de carga y descarga. Se trata de depósitos de productos de reacción del electrolito que siempre se forman. Dependiendo del vehículo y de la química de la batería, esto puede ocurrir de formas muy diferentes, por eso hay una gran variación en los datos. Sin embargo, la línea de tendencia de los más de 7.000 conjuntos de datos de vehículos proporciona una buena estimación.
Y los datos de los 50 vehículos P3 también coinciden con los resultados del análisis de Aviloo. Algunos de estos vehículos también se utilizaron para otras pruebas, por lo que el perfil de conducción y carga de estos vehículos puede ser más extremo que el de un coche de empresa que se utiliza principalmente para desplazarse al trabajo. No obstante, sus baterías han demostrado ser duraderas: "Casi todos los vehículos P3 probados tienen un SoH superior a 90%. Esto indica que las baterías de la flota P3 siguen funcionando muy bien a pesar de los distintos fabricantes, los diferentes perfiles de uso y el uso intensivo."
Otro hallazgo interesante de los más de 7.000 conjuntos de datos: Los datos de campo sugieren que la capacidad real de la batería se mantiene durante más tiempo del supuesto en condiciones reales, especialmente con los elevados kilometrajes citados a menudo de 200.000 kilómetros y más. Basándose en las pruebas de laboratorio de las células, el modelo SoH publicado por P3 en 2023 daba una previsión mucho más pesimista sobre la salud de las baterías. Hasta unos 50.000 kilómetros, el modelo de laboratorio y los datos de campo coinciden aproximadamente, por encima de los 100.000 kilómetros. Sin embargo, las líneas de tendencia divergen significativamente. P3 concluye que los perfiles reales de los usuarios y el control de las células por el sistema de gestión de la batería sobre el terreno reducen significativamente el envejecimiento.
Pero, ¿cómo puede explicarse la variación observada? Al fin y al cabo, algunos vehículos siguen teniendo un SoH extremadamente alto después de más de 50.000 kilómetros, mientras que algunos vehículos siguen estando al 98% después de casi 200.000 kilómetros, mientras que otros caen rápidamente por debajo del 90%. De hecho, el comportamiento de carga y uso de los conductores y de los propios vehículos influye en ello, al igual que los fabricantes. Por un lado, el búfer previsto (es decir, la diferencia entre la capacidad bruta y la neta) desempeña un papel importante en términos de tamaño y utilización del búfer. Esto se debe a que puede utilizarse, por ejemplo, para reducir el envejecimiento perceptible durante el periodo de garantía, liberando un poco más de capacidad neta con el tiempo. Por otro lado, el comportamiento de carga puede ajustarse mediante una actualización del software. Por un lado, puede tratarse de una mayor potencia de carga para tiempos de carga más cortos, lo que provoca un mayor estrés en la célula. Por otro lado, también es posible que una actualización mejore el control de las células, por ejemplo, optimizando el preacondicionamiento para reducir el estrés durante la carga rápida en condiciones subóptimas.
La base de datos se deteriora con un mayor kilometraje
Dos puntos de crítica a los conjuntos de datos no deben pasar desapercibidos: La propia P3 señala que la base de datos de vehículos con más de 200.000 kilómetros es significativamente menor que la de vehículos con menor kilometraje. "La razón es que sólo hay unos pocos vehículos con un kilometraje tan largo. Esto limita en cierta medida la validez de los datos para kilometrajes elevados y también provoca una mayor dispersión de los datos", afirma el estudio. También hay que tener en cuenta el "sesgo de supervivencia". Al fin y al cabo, sólo se midieron los vehículos de alto kilometraje que seguían siendo aptos para circular a los 200.000 o 300.000 kilómetros. No se incluyeron los vehículos que ya no se utilizaban por avería de la batería. Eso puede hacer que la fiabilidad de los vehículos parezca demasiado positiva. Pero el gran problema es que incluso si un coche eléctrico falla prematuramente, según las estadísticas de averías del ADAC a partir de 2023, sólo en ocasiones se debe a la batería de tracción. "Los casos individuales, como los fallos causados por un comportamiento de uso especial o por errores de producción, pueden seguir ocurriendo y a menudo se producen dentro del periodo de garantía, por lo que rara vez suponen un riesgo financiero para los consumidores", escribe P3.
Entonces, ¿qué pueden hacer los consumidores para mejorar la salud de las baterías y ralentizar el proceso de envejecimiento? A grandes rasgos, con una conducción y un comportamiento de carga cuidadosos. Para obtener una respuesta más detallada, hay que distinguir entre envejecimiento natural y cíclico. Importante: Se trata de afirmaciones generales. En casos individuales, es posible un comportamiento diferente según el vehículo y la batería. No obstante, las siguientes recomendaciones de P3 no dañarán la batería.
En el caso del envejecimiento del calendario con el paso del tiempo, los principales factores son la temperatura y el estado de carga. Cuando no se utilizan, las pilas prefieren temperaturas bajas o medias, por debajo de los 25 grados, según P3. Una temperatura demasiado alta (se habla de más de 60 grados) es una "fuerza motriz para las reacciones químicas, lo que conduce a una degradación acelerada de la capacidad". Sin embargo, el vehículo o la gestión de la batería también pueden ayudar en este sentido, como muestra nuestra inmersión técnica en la plataforma PPE del Grupo VW. El nivel de carga al que se estaciona un coche eléctrico durante un periodo de tiempo prolongado también es importante. Un mayor nivel de carga significa un mayor voltaje en la célula, lo que acelera el envejecimiento durante un periodo de tiempo más largo. P3 recomienda aparcar el vehículo con un nivel de carga de bajo a medio (del diez al 50%) para periodos de estacionamiento muy largos.
Una conducción y un comportamiento de carga suaves ayudan a la batería
La temperatura también desempeña un papel en el envejecimiento cíclico, es decir, en la utilización, pero en un ámbito diferente. Si la batería se utiliza, no debe estar ni demasiado caliente ni demasiado fría. Esto se aplica a la carga (rápida) y a la conducción. Las corrientes elevadas (carga rápida, fuerte aceleración, conducción a alta velocidad) no suelen favorecer el SoH, pero sobre todo a temperaturas extremas. En otras palabras, lo ideal sería un comportamiento de conducción moderado con velocidades bajas y constantes y cargas rápidas poco frecuentes a temperaturas medias, y con una profundidad de descarga baja, es decir, si el nivel de carga se mantiene entre el 20% y el 80%. No es el fin del mundo si se desvía de esto en casos individuales (porque la carga rápida también es necesaria en la autopista en invierno). Sin embargo, un comportamiento de conducción y carga predominantemente suave puede ralentizar el envejecimiento de la batería.
La encuesta también muestra que el envejecimiento real de las baterías rara vez incumple los términos de la garantía de las mismas. La garantía estándar para los sistemas de baterías de VE es actualmente de ocho años o 160.000 kilómetros, y los primeros fabricantes llegan hasta los 250.000 kilómetros y diez años. Lexus ofrece incluso una ampliación de la garantía hasta un millón de kilómetros o diez años en el (hay que reconocer que no se utiliza mucho) UX300e. Así pues, la batería suele durar mucho más que la garantía u otras partes del vehículo.
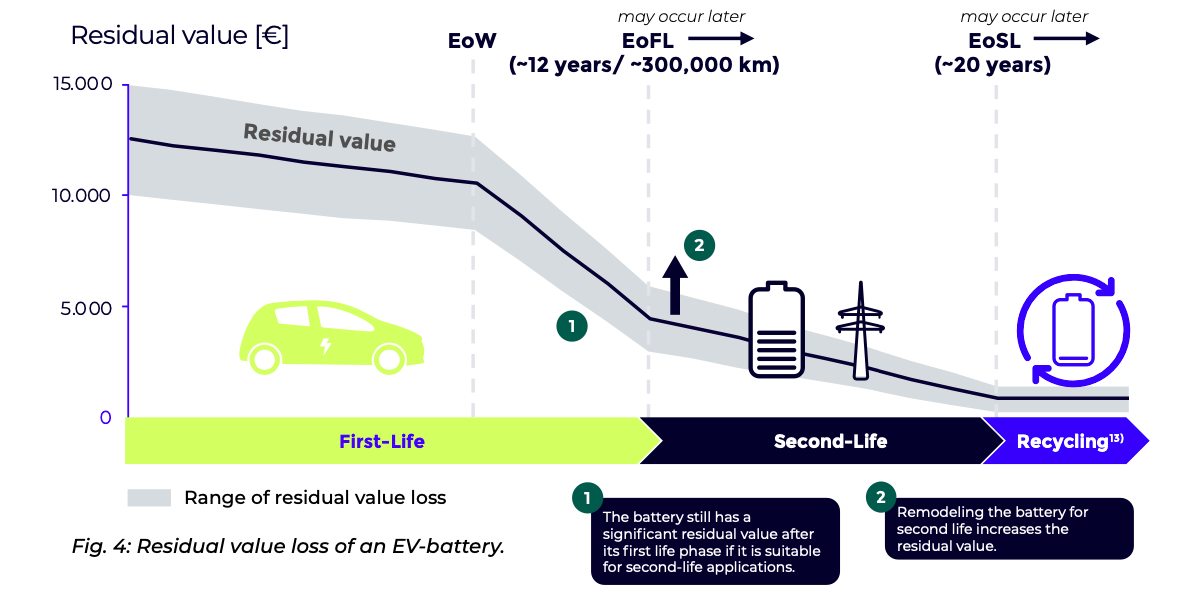
Con la larga vida útil, un segundo uso de la batería después de la "primera vida" en el vehículo es, por supuesto, también posible, por ejemplo, como almacenamiento estacionario de energía - la "segunda vida". Sólo después de este segundo uso, es decir, unos 20 años o más, una batería pasa al reciclaje. Al menos ese es el modelo.
Para responder a la pregunta planteada al principio sobre el valor residual, éste depende en gran medida de la fase de utilización actual. Dentro del periodo de garantía del fabricante, es naturalmente más alto que después de que la garantía haya expirado, aunque la batería del vehículo siga funcionando. El valor residual disminuye a medida que deja de sustituirse o repararse en garantía. "Dentro del periodo de garantía, la pérdida de valor depende en gran medida del envejecimiento y de la capacidad restante", escribe P3. "Tras la expiración de la garantía, cabe esperar una mayor pérdida de valor. Al final de la primera vida útil, dependiendo del coste de las baterías nuevas, la batería aún puede tener un valor residual significativo a través de un segundo uso."
p3-group.com (libro blanco para descargar)



28 Comentarios