P3 Charging Index: The best long-distance electric cars in the US
How do electric cars fare in the long haul? The P3 Charging Index this year, for the first time, focuses on the US market to see which electric car performs best on long-distance journeys. The selection includes the most prominent players in the American EV range and we got both the results and the analysis.
Unlike other indexes, P3 takes the vehicles’ consumption data and charging curves to depict the time they recharge to a certain range rather than comparing (claimed) charging power in kilowatts. The P3CI (CI for Charging Index) is, therefore, the time required to charge an electric vehicle to a specific range, and considers certain consumption data to find, how far that range may get you. Moreover, the consultants define the ideal charging behaviour: on a highway, for example, the ideal Charging Index of 1 would be achieved by a car able to charge enough energy in 20 minutes to drive 300 kilometres.
***
Now moving to US audiences and markets for the first time, P3, of course, uses miles instead of kilometres and EPA data for standardised consumption values. The new report is the first the German-based consultancy has done with the US and international markets in mind after publishing three reports on the long-distance capability of all-electric vehicles in Europe.
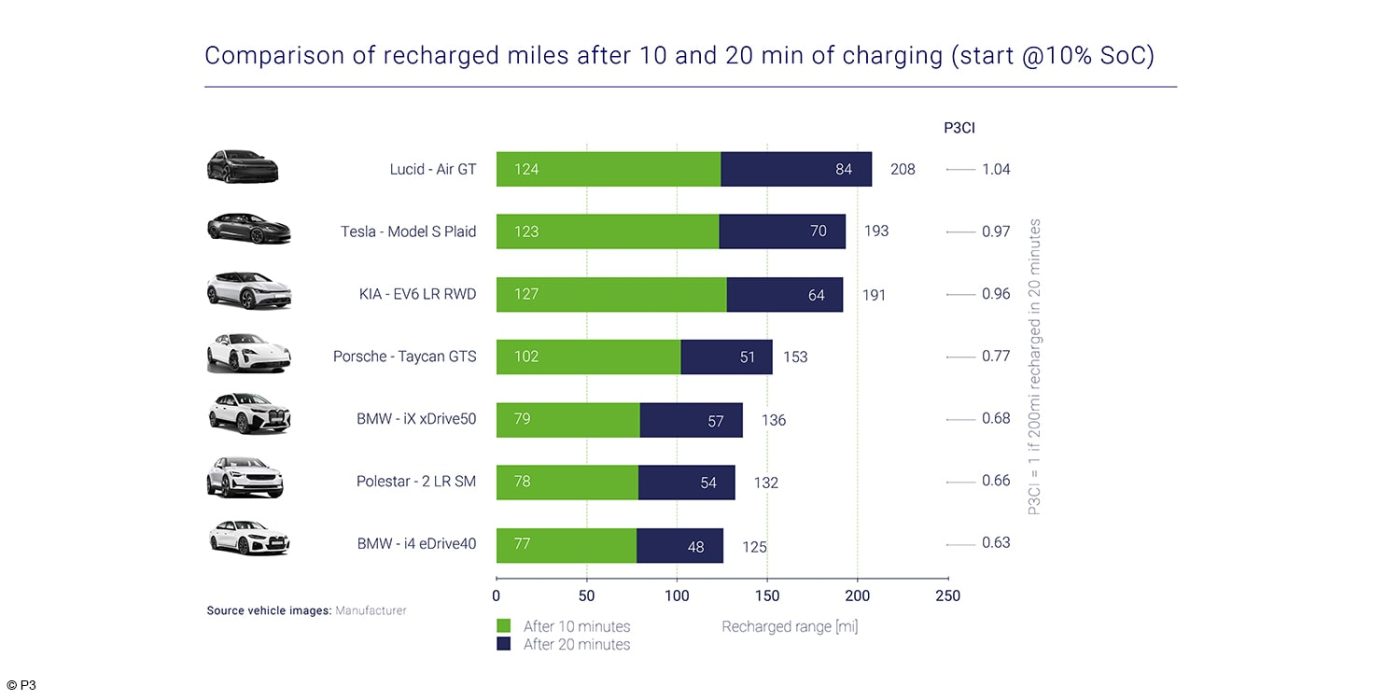
The target value mentioned above, i.e. a CI of 1 in the US, corresponds to an electric vehicle charging 200 miles of range within 20 minutes, starting from a low State of Charge of 10% SoC. This is a bit longer than the range required in Europe (321 instead of 300 km) and changed some results achieved in previous tests.
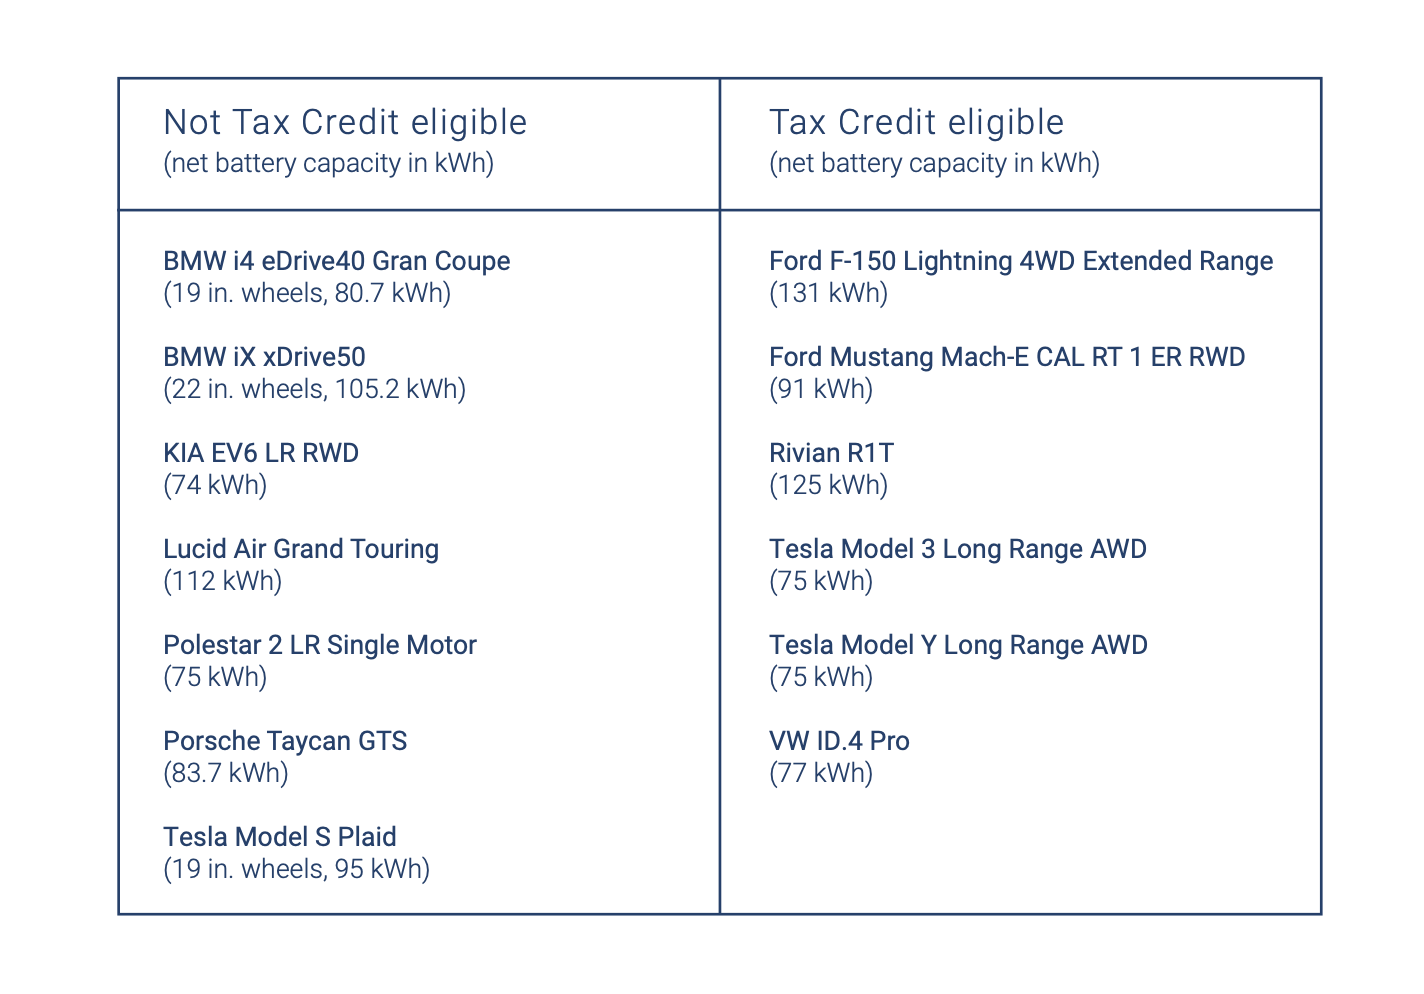
The US analysis also looked at charging only via CCS and Tesla’s proprietary system. This still enabled P3 to select 13 electric cars prominent in the US, taking into account availability for testing and sales data. The consultants also categorised the vehicles into eligible or non-eligible for the federal tax credit, essentially introducing price classes similar to its tests in Europe.
The cars in the running included models specific to the USA and some German and other oversea contenders, such as the Kia EV6 or Polestar 2.
During testing, the vehicles were charged and charging power, total recharged energy and time were recorded for each SoC stage. All charging curves shown were measured by P3 experts at charging stations of the same network provider in California (unnamed), with a maximum charging power of 350 kW. The Tesla Model 3, Model Y and Model S Plaid in the test were measured at V3 Superchargers since these models in the United States reportedly lack a built-in CCS 1 connector.
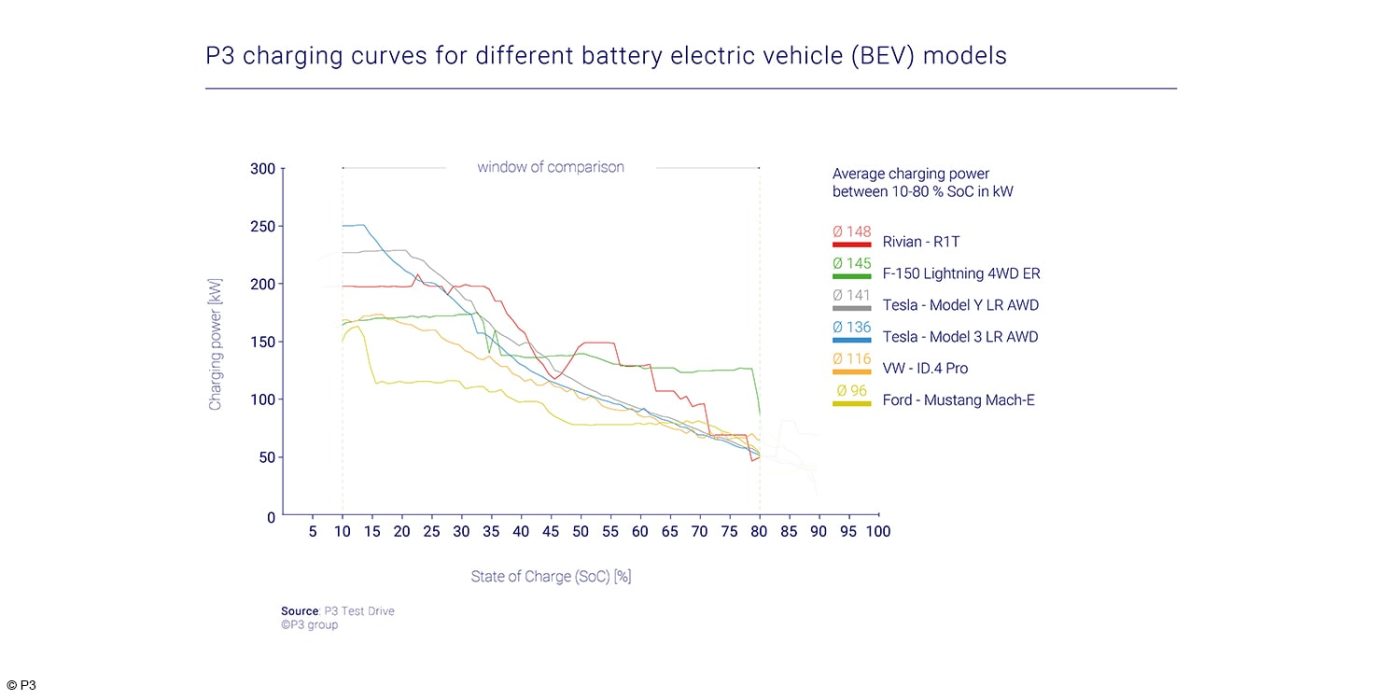
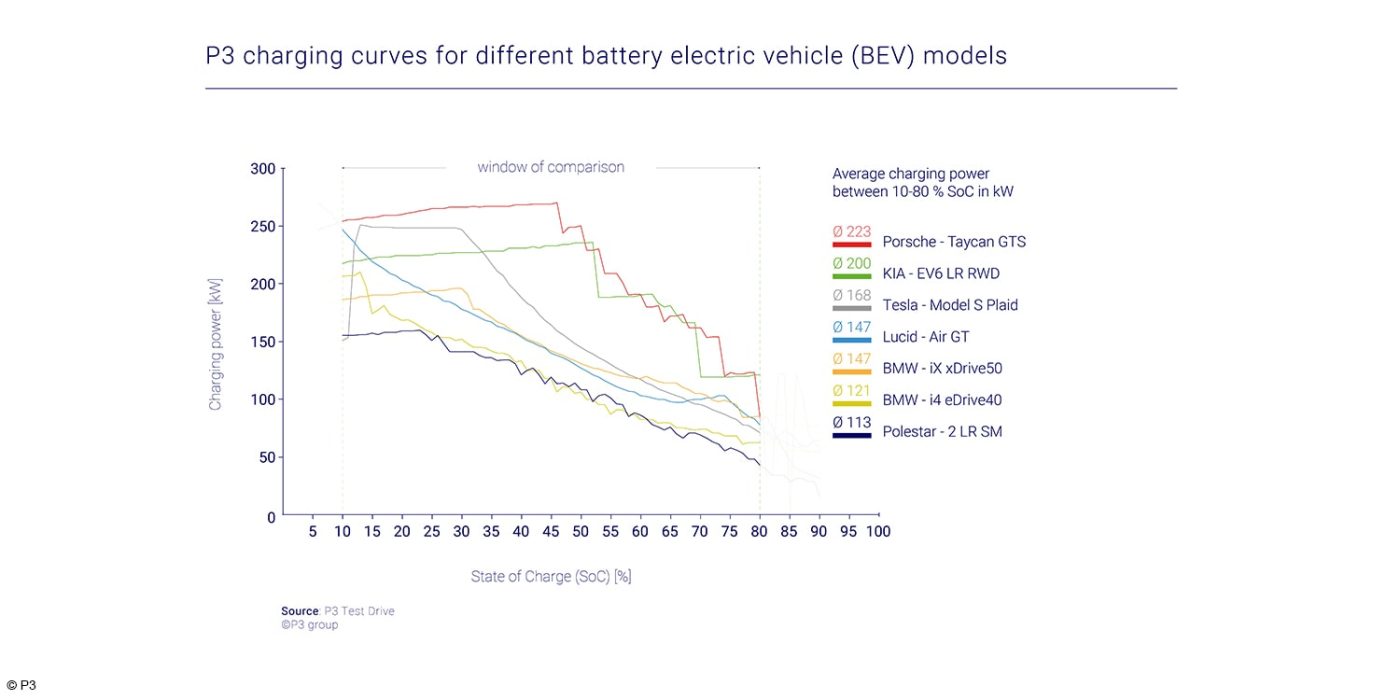
Since charging behaviour is also naturally conditional and impacted by ambient conditions such as temperature and available power at the charging station, P3 says it compared the charging speeds under ideal conditions. They found said conditions in California in April and allowed each car to reach maximum charging power. This requires the battery to have a relatively low SoC and be preconditioned for fast charging. They also measured multiple charging cycles per vehicle. However, rather than “just” taking maximum charging power, which most vehicles reach only for a short term, the charging index seeks an average charging power by looking at a “charging window” between 10%-80% SoC.
That is enough said about the P3 methodology. Almost. To finally calculate the actual recharged range, P3 uses official consumption values. In the US, these come from the EPA.
Looking at the top three, the Lucid Air GT has the largest battery among the unsubsidised EVs with a net capacity of 112 kWh and the third largest battery in the entire US P3 Charging Index. While this could lead to a lower refill rate, the Air also has a low EPA consumption of only 26 kWh / 100 mi. This is the lowest consumption among all 13 vehicles and can only be matched by the Tesla Model 3 LR AWD. Based on EPA consumption values, the Lucid Air GT also consumes 15 kWh / 100 mi less than the Porsche Taycan GTS, as the Porsche has an EPA value of 41 kWh / 100 mi. As you will see, this low efficiency will also be the downfall of the Taycan, despite impressive peak charging powers and its 800 V architecture.
The Tesla Model S Plaid also consumes more than the Lucid, with 29 kWh / 100 mi. On the other hand, the battery capacity is lower at 95 kWh but still higher compared to Tesla Model 3 and Model Y of the ‘Tax Credit eligible’ category with 75 kWh each.
The Kia EV6 LR RWD shares the consumption value of Tesla’s Model S Plaid with 29 kWh / 100 mi, but its battery is smaller, with 74 kWh net battery capacity.
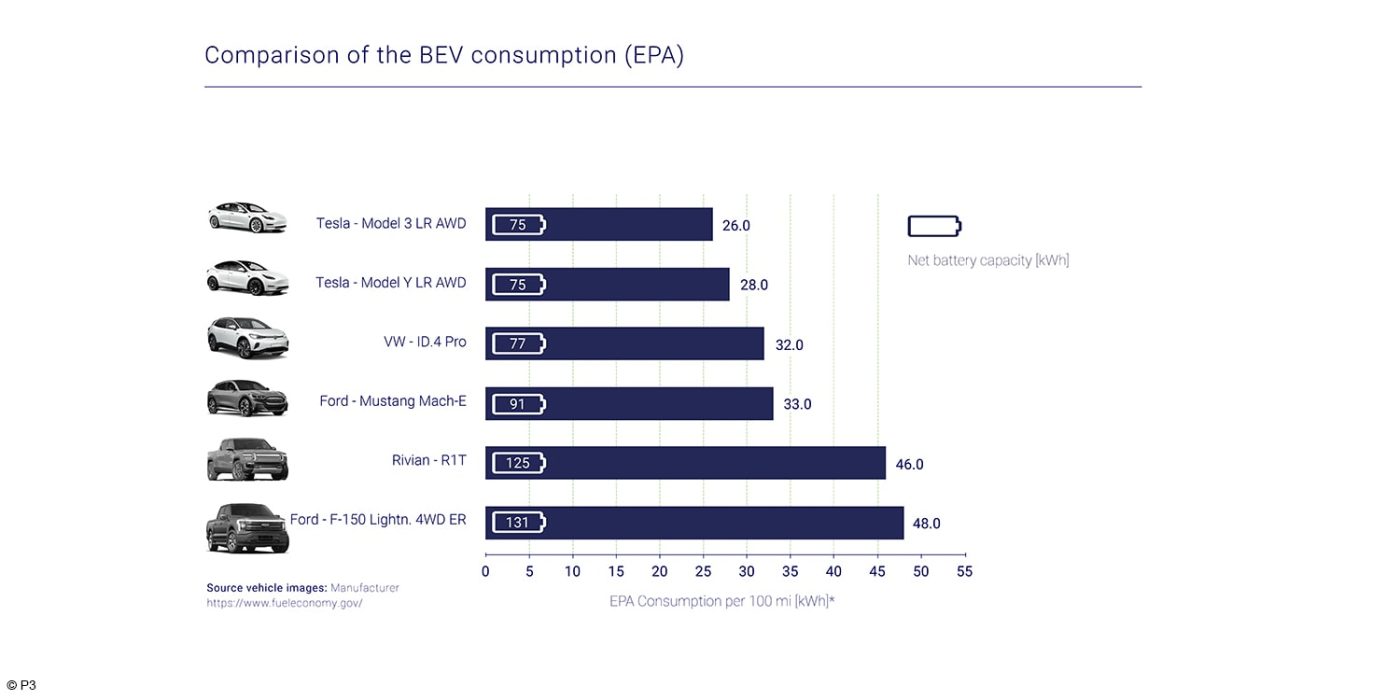
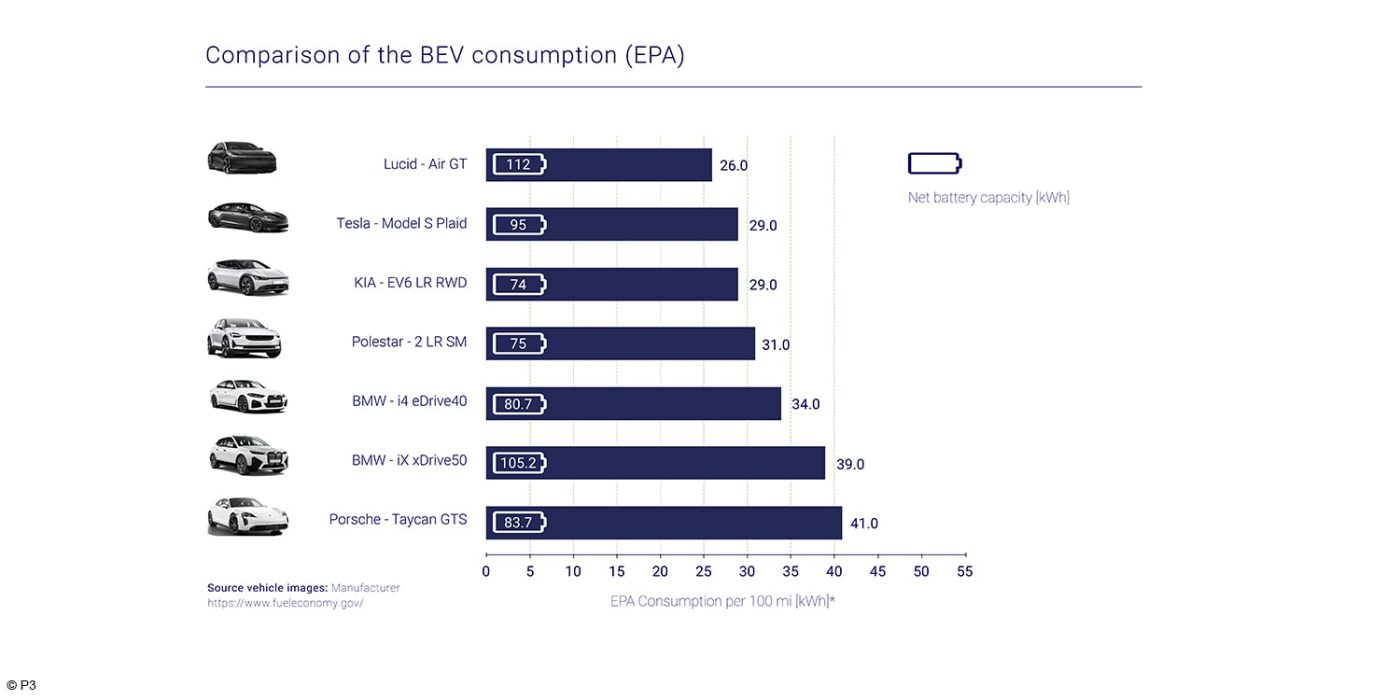
The difference in consumption, in other words, efficiency, or, as P3 puts it, the actual distance the recharged range will take a driver in that vehicle, also makes the final results of the charging indexes.
The final ranking of the P3 Charging Index US
It leaves the Lucid Air as the vehicle best suited to long-range journeys with a CI of 1.04 across all categories. Its average charging power of 147 kW was outweighed by its low consumption, resulting in 208 recharged miles after 20 minutes. The premium sedan is, therefore, the second-ever vehicle to reach a CI higher than 1; previously, the title was held by the Kia EV 6 in July 2022, a time when the Lucid EV would not compete in Europe.
As for the Kia EV6 in the US ranking, it still comes in third overall with a CI of 0.96, corresponding to 191 miles recharged after 20 minutes. It also sets the Kia right behind the Tesla Model S Plaid with a CI of 0.97. The Kia benefits from its high charging power above 200 kW until 52% SoC, whereas the Tesla Model S Plaid charges below 200 kW already at 38% SoC.
The Porsche Taycan, with its impressive charging powers but higher consumption, ranges in fourth place with a CI of 0.77 (based on 153 recharged miles in 20 minutes) – but only in the luxury car ranking.
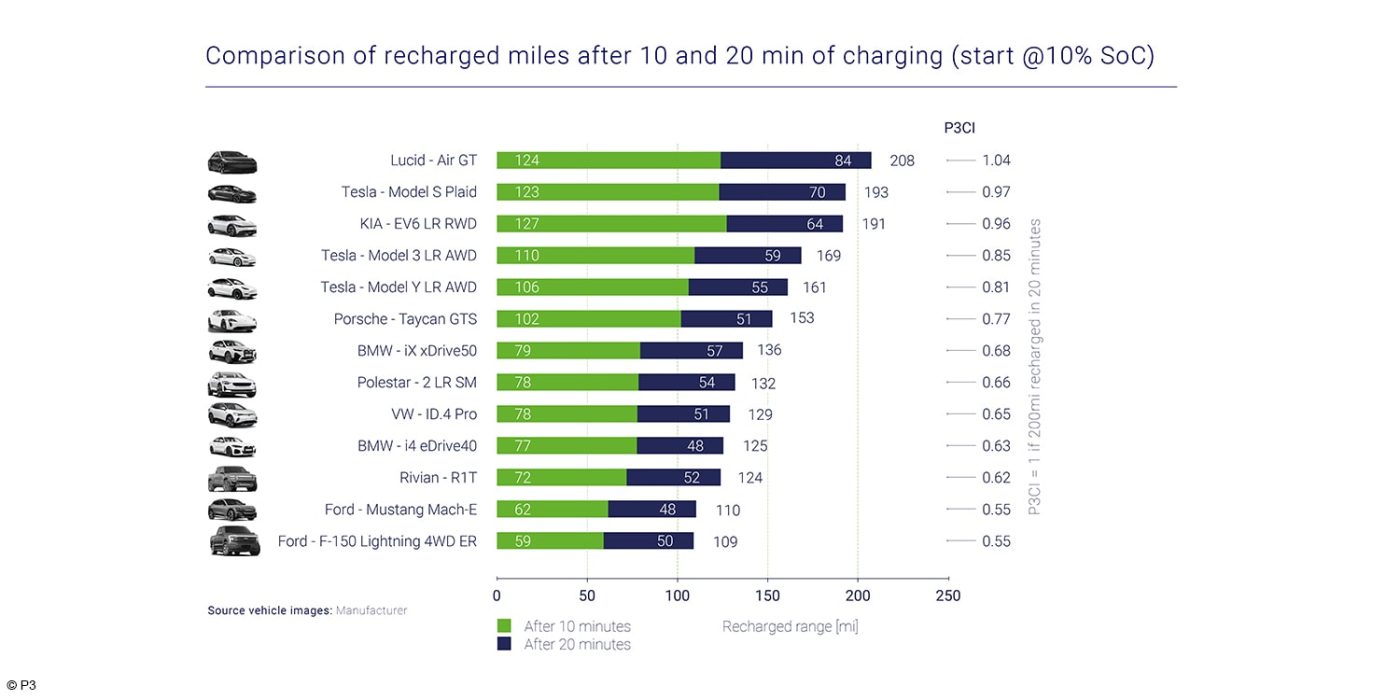
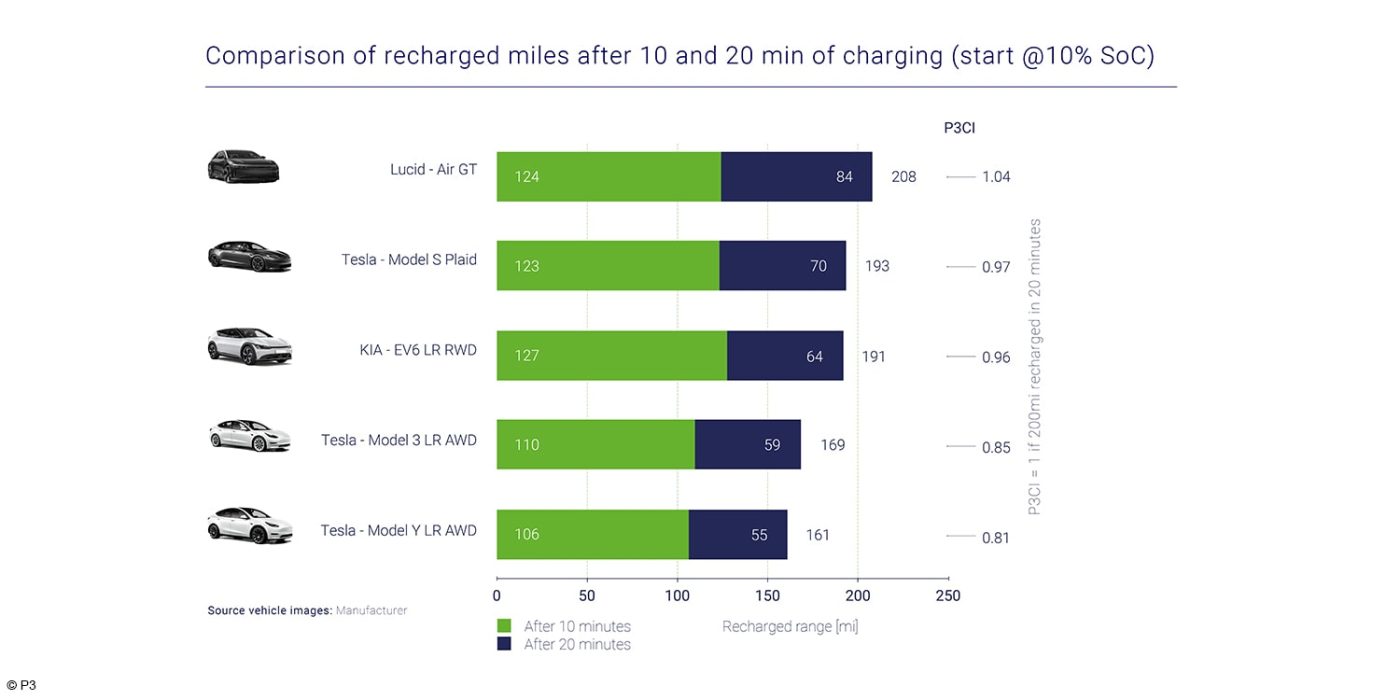
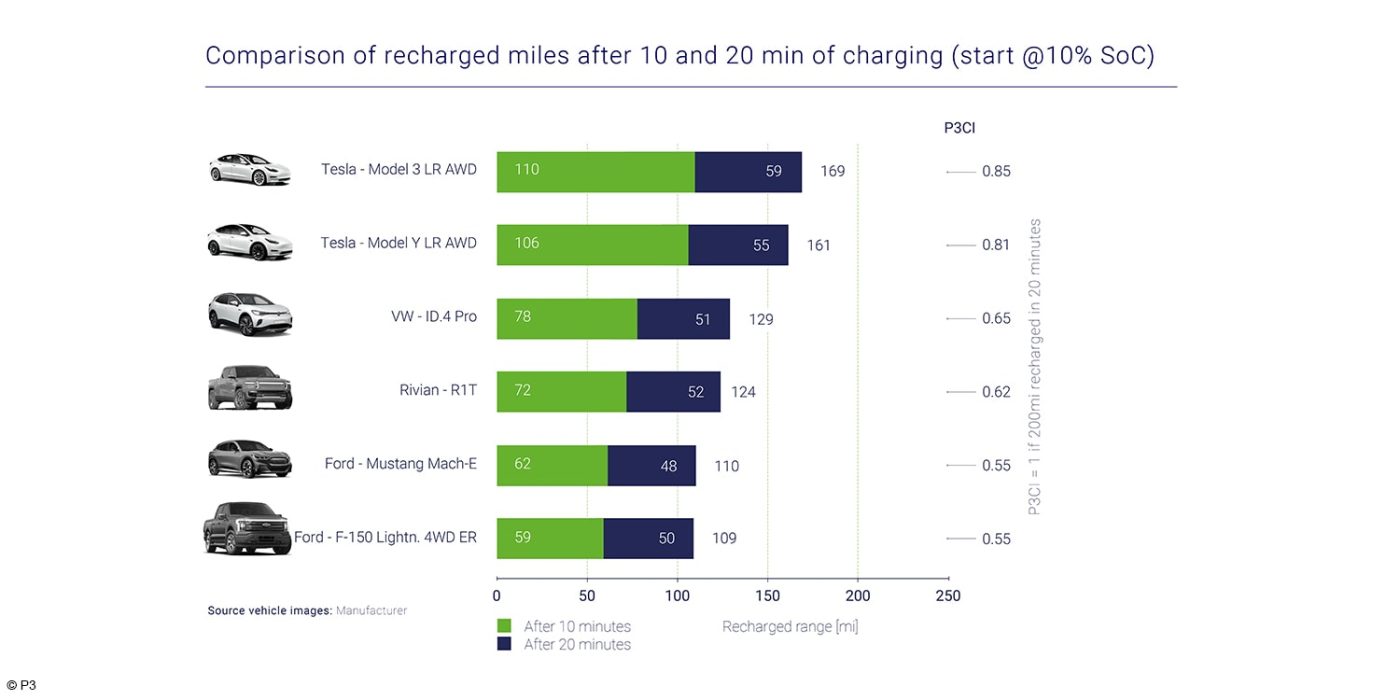
Taking into account the cheaper contenders, the overall ranking changes further. The Tesla Model 3 and Y overtake the Porsche with charging indexes of 0.85 and 0.81, respectively, so Tesla secures three of the top five places in the 2023 P3 charging index and pushes Porsche to rank six overall.
Further behind, the VW ID.4 exhibits a range of 129 miles in 20 minutes with its 400 V architecture, leading to a CI of 0.65. The consultancy writes that despite a lower average charging power of 116 kW, low consumption of 32 kWh / 100 mi can still result in “satisfactory charging”.
As for the all-important pickup trucks in the US, the Rivian R1-T and Ford F 150 Lightning make for lower long-distance suitability with CIs of 0.62 and 0.55. Still notably for P3, the Rivian R1T maintains a charging capacity of about 200 kW up to 35% SoC, allowing faster charging. In contrast, the Ford F-150 only charges up to 175 kW in that range, despite its average charging of 145 kW being similar to that of its pickup competitor Rivian which also has a comparable battery capacity.
Conclusion
In summary, P3 points out that while two of the leading three cars are non-eligible for tax credits, the Kia proves that non-luxury vehicles are capable of long ranges – a fact also found in the European index of 2022 that showed that the mix of battery size, consumption and charging performance counts.
For the US analysis, four of the top five cars are US models, and three come from Tesla. Here, P3 points out that while the Tesla cars have only a 400-Volt architecture and lower charging powers, their low consumption lifts their ranking.
Reversely, high consumption and low charging speeds bring down vehicles like pickup trucks. This, however, may be something to look at for manufacturers since these vehicles can often be found in rural areas with longer distances and less charging infrastructure. Here, P3 suggests companies should look at improving charging performance overall, also by careful software advances and 800 V architectures rather than further increasing battery capacities as the primary way forward.
presseportal.de, p3-group.com (download report as pdf)

0 Comments